Blow On This Chart $BLOW
42
PumpScore 42/100 Grade D
As of Aug 12, 2026 11:00, Blow On This Chart (BLOW) is rated 42/100 by PumpScore - weak market structure. The token is 5 hours old, priced at $0.00000928, with $100K in 24h volume and a balanced buy/sell mix.
How BLOW scores
On the strength side, trade participation leads at 100/100. On the risk side, liquidity depth lags at 0/100.
Liquidity depth0
Liquidity vs market cap0
24h trading volume97
Healthy turnover55
Buy / sell balance99
Trade participation100
Survival time22
Market-cap tier65
Price stability54
Volume vs liquidity0
Price
$0.00000928
Market Cap
$9.3K
24h Volume
$100K
Liquidity
$-
24h Change
+259%
24h Buys / Sells
1K / 814
Tip Struggling to get volume on this token? A Pump.fun King of the Hill bot can push real trading activity and help it trend on Pump.fun.
About Blow On This Chart
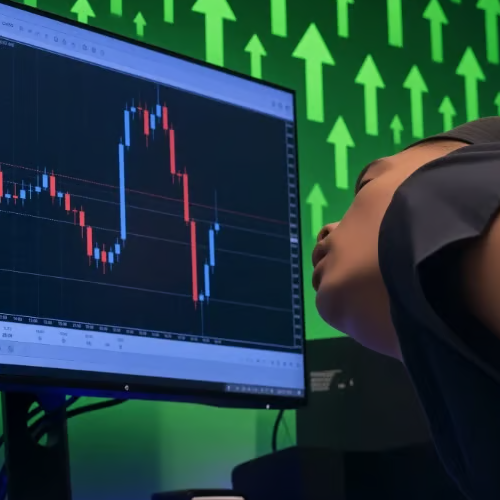
Blow on this chart.
Contract
8meCZHFajeBEV44NQxkZPK9z7jPtRfqsfps7DjgPpump
Questions about Blow On This Chart
How is BLOW rated on PumpScore?
As of Aug 12, 2026 11:00, BLOW scores 42 out of 100 on PumpScore (Grade D). The score weighs thin liquidity, heavy volume and balanced trading into one number.
Why does Blow On This Chart score 42?
The main driver of the BLOW score is trade participation (100/100); the main drag is liquidity depth (0/100). Each signal is weighted and combined into the 42/100 total.
Is Blow On This Chart safe?
PumpScore measures market structure, not intent, so it cannot certify safety. Blow On This Chart is only 5 hours old, its score is 42/100 (weak), and new Pump.fun tokens are extremely high risk. Verify the contract on Solscan and do your own research.
Is Blow On This Chart volume real?
Volume looks heavy at $100K. Because outsized volume on thin liquidity can signal wash trading, that ratio feeds directly into the 42/100 score for Blow On This Chart.
How much liquidity does Blow On This Chart have?
BLOW shows $- in its pool (thin depth). Deeper liquidity relative to the $9.3K market cap generally means steadier prices and lower rug risk.