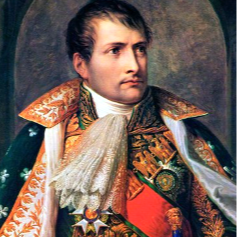
Historical Figure $FIGURE
76
PumpScore 76/100 Grade B
FIGURE, the ticker for Historical Figure, scores 76 out of 100 on PumpScore as of Jul 28, 2026 09:00. That grade reflects thin liquidity, active 24-hour volume and balanced order flow on the Solana blockchain.
Score breakdown
On the strength side, survival time leads at 100/100. On the risk side, market-cap tier lags at 24/100.
Liquidity depth33
Liquidity vs market cap100
24h trading volume89
Healthy turnover55
Buy / sell balance95
Trade participation100
Survival time100
Market-cap tier24
Price stability93
Volume vs liquidity71
Price
$0.00000274
Market Cap
$2.6K
24h Volume
$53.4K
Liquidity
$2.5K
24h Change
-79.73%
24h Buys / Sells
1.2K / 1.1K
Tip Low on trading activity? Many Solana creators use a Solana token volume bot to build steady volume and chase King of the Hill.
Contract
HJF7Z85uvRtyBGSdXFuRv43Md3YjAgeTzP8LcEktpump
Frequently asked questions
Is FIGURE a good investment?
PumpScore does not give buy or sell advice. A 76/100 grade describes healthy market structure for Historical Figure, not its future price. Newly launched tokens are speculative - only risk what you can lose.
How do I trade Historical Figure?
FIGURE trades on Solana via Pump.fun and graduated AMMs. Its contract is on this page - copy it from Solscan and confirm it matches before trading Historical Figure.
Why does Historical Figure score 76?
The main driver of the FIGURE score is survival time (100/100); the main drag is market-cap tier (24/100). Each signal is weighted and combined into the 76/100 total.
How old is Historical Figure?
FIGURE is roughly 1 day old. Very young tokens score cautiously until they prove they can hold liquidity and trading over time.
What is the FIGURE price?
Historical Figure is priced at $0.00000274 (-79.73% in 24h), giving it a $2.6K market cap on $2.5K of on-chain liquidity as of Jul 28, 2026 09:00.